
Identifying Heterogeneity Within Rare Cell Populations By Pairing Single-Cell RNA-Seq With Cell Sorting

The adoption of single-cell techniques has highlighted important cell-to-cell heterogeneity in a wide range of research areas and has led to the realization that to truly understand human biology and disease we need to understand how the behavior of individual cells shapes biological processes.
Single-cell RNA-Seq (scRNA-Seq) has emerged as a powerful tool in this effort as it allows whole genome gene expression profiling of hundreds to thousands of individual cells in a single experiment. scRNA-Seq has enabled a wide range of discoveries including identification of new cell types linked to diabetes and Alzheimer’s disease (Keren-Shaul et al. 2017, Segerstolpe et al. 2016), investigation of developmental processes such as stem cell differentiation (Han X et al. 2018) and human embryo development (Petropoulos et al. 2016), and tracking of heterogeneity in cell response to drug treatment (Levitin et al. 2018) or during disease progression (Potter 2018). Key to these important discoveries was the ability to study cells in their true biological context (that is, living tissue) rather than studying these processes in immortalized cell lines.
Click Here For More Information on the S3e Cell Sorter
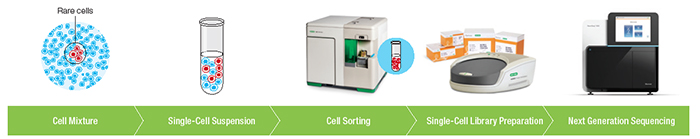
Here we demonstrate that this already powerful method can be further enhanced by pairing it with cell sorting to enable characterization of rare cell populations such as CD34+/CD45+ human hematopoietic stem and progenitor cells (HSPCs). These cells are one of the rarest peripheral blood mononuclear cell (PBMC) subpopulations, present at less than 1%, but can be characterized in exquisite detail by using the S3e Cell Sorter upstream of the Illumina Bio-Rad Single-Cell Sequencing Solution (Figure 1) to enrich for highly pure and viable CD34+/CD45+ HSPCs. Subsequent whole genome gene expression analysis of this rare cell type allowed us to identify and characterize three unexpected subpopulations within these samples.
Materials And Methods
Cell Sorting
Fresh purified PBMCs (AllCells, catalog #PB002, 3.5 x 10⁸ cells) were stained with the following monoclonal antibody panel: FITC anti-human CD45 (BioLegend, #304006) and PE antihuman CD34 (BioLegend, #343606). Approximately 350 million cells were separated into ten samples, which were prepared to run on the S3e Cell Sorter. Cells were stored in Dulbecco’s Modified Eagles Medium (DMEM), with 30% FBS until acquired by flow cytometry. Just prior to analysis, the cells were washed in phosphate buffered saline (PBS) supplemented with 2% FBS (sort buffer). The cells were resuspended in sort buffer and passed through a 70 micron filter to remove clumps. 7-AAD (Bio-Rad Laboratories, #1351102) was used for live/dead post-sort analysis.
Flow cytometry analysis and cell sorting were performed on the S3e Cell Sorter using ProSort Software (Bio-Rad Laboratories, #1451008) for acquisition and sorting. Four plots were used to generate the specific gate for the sorted population: FSC area vs. SSC area (all cell population), FSC height vs. FSC area (doublet discrimination), CD45 FITC area vs. SSC area (PBMCs), and CD45 FITC area vs. CD34 PE area (stem cell population). FSC and SSC were collected on a linear scale, while all fluorescent channels were collected on a log scale. Using Purity Mode, the CD34+/CD45+ population of cells were targeted for the sort population. Viable cells were then sorted into DMEM with 30% FBS on the S3e Cell Sorter. The cells were sorted and kept at 4°C until required for scRNA-Seq. Each of the ten samples had a final volume of 4.5 ml at approximately 8 million cells/ml and took a total of 1 hour to sort. Post-sort analysis of the sorted cells used the same gating strategy.
Single-Cell RNA-Seq
Cell concentration of sorted CD34+/CD45+ cells was determined using the TC20 Automated Cell Counter (Bio-Rad Laboratories, #1450102) and adjusted to a final concentration of 2,500 cells/μl. Cells were then prepared for single-cell sequencing using the Illumina Bio-Rad SureCell™ WTA 3' Library Prep Kit for the ddSEQ System (Illumina, #20014280). Cells were loaded onto two ddSEQ Cartridges in eight technical replicates and processed in the ddSEQ Single-Cell Isolator (Bio-Rad Laboratories, #12004336) to isolate and barcode single cells in droplets. First-strand cDNA synthesis occurred in droplets, which were then disrupted for secondstrand cDNA synthesis in bulk. Libraries were prepared according to manufacturer’s instructions and then sequenced on the NextSeq™ 500 System. Sequencing data were analyzed using the SureCell RNA Single-Cell App in the BaseSpace™ Sequence Hub. Tertiary analysis was performed using the Seurat R toolkit for single-cell genomics (satijalab.org/seurat/) developed by the Satija Lab at New York Genome Center (Butler et al. 2018).
Results and Discussion
Isolation of an Extremely Rare Cell Population
CD34+/CD45+ cells are one of the rarest PBMC subpopulations (<1% of PBMCs). These blood cell progenitors were sorted to high purity and viability from PBMCs based on cell surface expression of CD34 and CD45 by using the S3e Cell Sorter. This step allowed us to enrich for a rare cell population of interest, ensure its purity, and eliminate dead cells and debris from our downstream analysis.
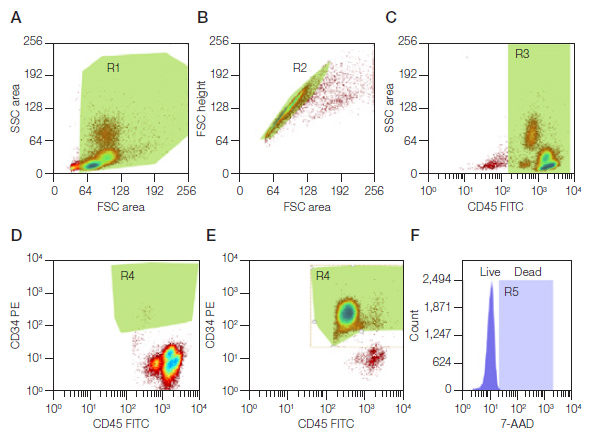
Figure 2 shows representative plots that illustrate the gating strategy for isolation of CD34+/CD45+ cell populations. Briefly, we examined the entire cell population excluding debris (Figure 2A), followed by doublet exclusion (Figure 2B). Red blood cells were excluded by selecting for CD45+ cells (Figure 2C) and finally the CD34+/CD45+ population was selected (Figure 2D). Only cells that fell into this final region were selected for sorting. 7-AAD was used to verify the viability of the cells post sort. The resulting sorted cells revealed 97.8% purity (Figure 2E) and greater than 98% viability (Figure 2F).
Transcriptional Profiling of CD34+/CD45+ Cells Reveals Unexpected Heterogeneity
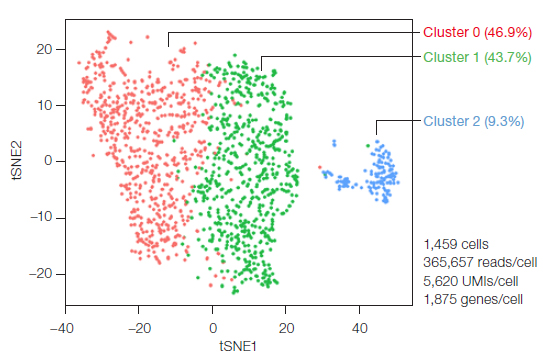
Transcriptomes of the isolated CD34+/CD45+ cells were sequenced using the Illumina Bio-Rad Single-Cell Sequencing Solution. Unbiased clustering of the CD34+/CD45+ cells was performed following instructions from the guided tutorial for the Seurat R toolkit for single-cell genomics. This analysis revealed unexpected heterogeneity in this CD34+/ CD45+ population — at least three transcriptionally distinct populations, clusters 0, 1, and 2, were identified (Figure 3).
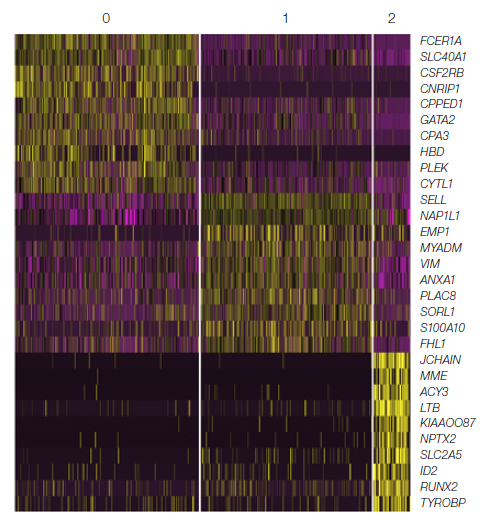
Cells from each of these clusters were then characterized using heat map analysis of their gene expression patterns (Figure 4). Each cluster showed a distinct gene expression profile, supporting the clustering of three subpopulations shown in the t-SNE plot and providing first insights into the biology that underlies this heterogeneity.
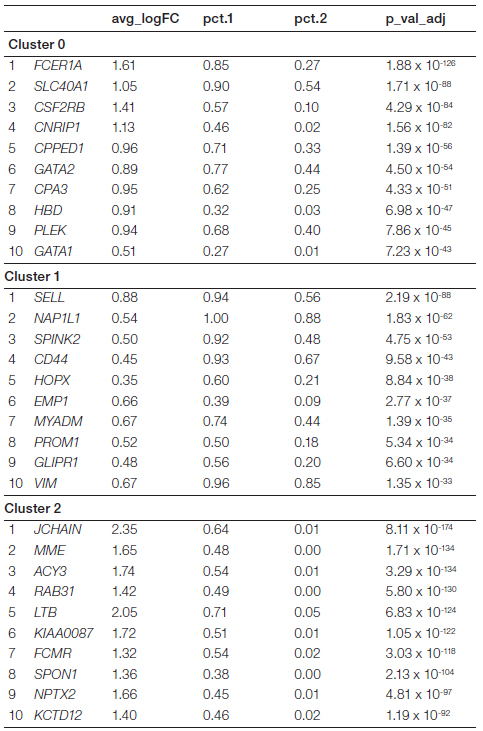
To better understand these subpopulations we identified the top ten differentially expressed genes in each cluster (Table 1). We then mapped the genes that were most highly differentially expressed in each cluster onto the original t-SNE plot to identify genes that were uniquely and exclusively up- or downregulated in each cluster (Figure 5A). Violin plot analysis of these markers confirmed that the identified genes were exclusively expressed in their respective subpopulation (Figure 5B). This allowed us to confirm that these genes could be used as markers for the newly identified subpopulations in future studies to understand the biological role of these cell types.
Conclusion
We have demonstrated that cell sorting can be an important and powerful complement to single-cell gene expression analysis by allowing enrichment of highly pure and viable rare cell populations for downstream analysis. This enrichment step provided sufficient high-quality sample to provide high-resolution insight into the gene expression profiles of rare CD34+/CD45+ cells and resulted in identification of unexpected subpopulations. We were able to use our data to identify potential biomarkers for each of these subpopulations that can be used in future studies to elucidate their role in myeloid cell line development. This workflow will enable a wide range of research applications to further our understanding of how cell heterogeneity drives human biology and disease.
References
Butler A et al. (2018). Integrating single-cell transcriptomic data across different conditions, technologies, and species. Nat Biotechnol 36, 411–420.
Han X et al. (2018). Mapping human pluripotent stem cell differentiation pathways using high throughput single-cell RNA-sequencing. Genome Biol 19, 47.
Keren-Shaul H et al. (2017). A unique microglia type associated with restricting development of Alzheimer’s disease. Cell 169, 1,276–1,290.
Levitin HM et al. (2018). Single-cell transcriptomic analysis of tumor heterogeneity. Trends Cancer 4, 264–268.
Petropoulos S et al. (2016). Single-cell RNA-Seq reveals lineage and X chromosome dynamics in human preimplantation embryos. Cell 165, 1,012–1,026.
Potter SS (2018). Single-cell RNA sequencing for the study of development, physiology, and disease. Nat Rev Nephrol [published online ahead of print May 22, 2018]. Accessed May 25, 2018.
Segerstolpe Å et al. (2016). Single-cell transcriptome profiling of human pancreatic islets in health and type 2 diabetes. Cell Metab. 24, 593–607.
Visit bio-rad.com/ddSEQ or bio-rad.com/S3e for more information.