
Capital Raising For Cell & Gene Therapies: How To Craft Your Elevator Pitch
By Brad Miller, Biosceptre

Within the commercial and corporate biotech space, we often hear of the need for an “elevator pitch” in the context of raising capital – a brief 30-second persuasive speech to spark interest and engage with your audience in the hope that further discussion (and ultimately an equity investment) is forthcoming. While the principles of an elevator pitch (the ability to engross your audience as you convey your message) are equally relevant within the clinical drug development space, the theme and content of your elevator pitch will likely require modification dependent on your audience.
Within the cell therapy space, cytokine release syndrome (CRS) and neurotoxicity are an area of significant interest to patients, researchers, investigators, investors, and regulatory agencies. To explore the concept of the elevator pitch within clinical drug development, we will consider CRS and how the considerable quantity of data captured in a clinical study can be presented in a short, sharp, and concise manner by developing an elevator pitch that will quickly convey relevant information and context.
What Is Cytokine Release Syndrome?
The National Cancer Institute (NCI) Common Terminology Criteria for Adverse Events (CTCAE) v5.0 criteria defines CRS as a disorder characterized by fever, tachypnea, headache, tachycardia, hypotension, rash, and/or hypoxia caused by the release of cytokines.1
Similarly, the American Society for Transplantation and Cellular Therapy (ASTCT) defines CRS as a supraphysiologic response following any immune therapy that results in the activation or engagement of endogenous or infused T cells and/or other immune effector cells and notes that symptoms can be progressive, must include fever at the onset, and may include hypotension, capillary leak (hypoxia), and end organ dysfunction.2
While this article refers exclusively to the ASTCT CRS consensus grading criteria, there exist several alternative grading criteria, including the CTCAE criteria, the Lee criteria, the Penn criteria, the MSKCC criteria, and the CARTOX criteria. While it is beyond the scope of this article to address the documented advantages and disadvantages of these different criteria, similar principles and conclusions can be drawn regarding the presentation of data and the concept of the elevator pitch.
The Audience’s Perspective – What Is Most Important To Convey
The more conversations you hold, the more likely you will identify patterns of interest and a logical flow of interrogation about your early-stage clinical programs by various audiences. For instance, practicing clinicians will often query clinical outcomes, investors want to discuss preliminary signals of efficacy and the likelihood of success of one or more expedited pathways, and scientists may want to undertake a deep dive of the mechanism of action and the hypothesized pharmacokinetic profile of the study drug. However, each audience understands the fundamental principle that a study drug that does not meet its safety and tolerability hurdles is unlikely to be further developed into a commercial product, and therefore each audience will also ask a variation of “what is the safety profile of the study drug?” “is the product tolerable?” and “what adverse events occurred?”.
However, when they ask, “is the product tolerable?”, most audiences are not requesting a 20-minute summary of each treatment-related treated emergent adverse event leading to study drug withdrawal. What they are requesting, within the context of an elevator pitch – and I stress that this is heavily audience dependent – is a high-level summary of the events they need to be aware of, at a level they will understand.
One of the issues we have in clinical drug development is that we are spoiled for choice when it comes to data. Clinical operations teams the world over pour their heart and soul into each drug development program and each clinical study, and when an audience shows an interest (regardless of how fleeting), we instinctively want to scream from the rooftops to convey each and every insight we obtained throughout the study.
Similar to our safety and tolerability queries, where our audience wants to understand the adverse event profile and high-level overview statistics without necessarily being “in the weeds,” we can identify several broad CRS outcomes that are likely to be of some interest to our identified audience and therefore should be addressed in our elevator pitch:
- incidence and grading of CRS; and
- time-to-event characteristics of CRS.
Take Action – How To Summarize
Once you understand the needs of your audience, consideration should turn to how best to satisfy those needs, while also conveying the information in the fewest words possible. The intention here isn’t to provide a story, but rather develop a representation of the most critical data around which an elevator pitch can be crafted.
The data in Table 1 are from a fictitious clinical study; they do not represent actual data obtained from any clinical study and are intended to spark conversation and provide an illustrative example only.
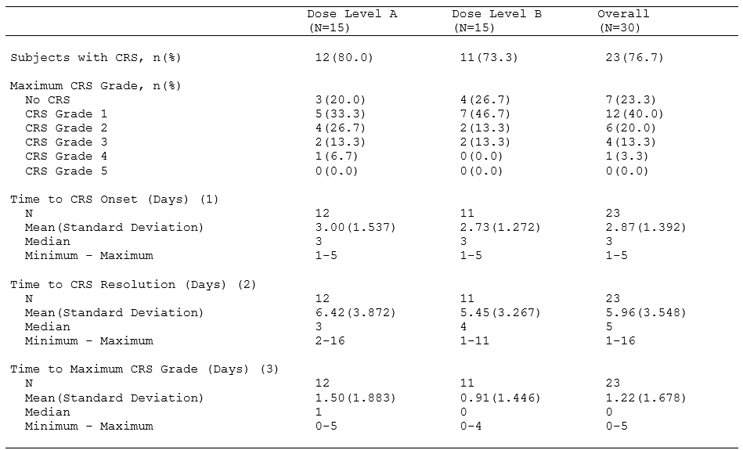
Table 1: Cytokine Release Syndrome: Summary of Incidence According to ASTCT CRS Consensus Guidelines by Dose Level and Overall (Safety Population. CRS was coded using the ASTCT CRS consensus guidelines.
ASTCT: American Society for Transplantation and Cellular Therapy; and CRS: cytokine release syndrome.
(1) Time to CRS Onset (Days): date of CRS onset – date of study drug administration.
(2) Time to CRS Resolution (Days): date of CRS resolution – date of CRS onset.
(3) Time to Maximum CRS Grade (Days): date of maximum CRS grade – date of CRS onset.
As can be seen in Table 1, we propose the following considerations.
First, information should always be conveyed at the highest possible summary level, thereby allowing the most basic understanding of the event or assessment of interest. In this example, we present a summary of the number and percentage of subjects who experienced CRS while in the study (and by definition, the audience can determine the number and percentage of subjects who did not experience CRS).
Second, we start to build our story by providing a more detailed summary, thereby facilitating a more nuanced understanding of the severity of the event or assessment of interest. In this example, we present a summary of the number and percentage of subjects by maximum grade of CRS experienced while in the study (noting that per the ASTCT consensus grading criteria, Grade 1 CRS is mild and Grade 5 CRS is death due to CRS).
A keen observer will identify that we have already addressed the first broad outcome that we identified would likely be of interest to our audience – the incidence and grading of CRS.
Third, we can now start to report our time-to-event characteristics that will provide the extent of the event or assessment of interest. While we can appreciate that the definition of “tolerable” is dependent on many factors (indication under investigation, stage of disease, relapsed/refractory status, age, etc.), a short-lived event that is mild in severity is much more “tolerable” than a long-suffering event that is life-threatening.
In this example, we propose time of CRS onset (relative to study drug administration), time to CRS resolution (relative to time of onset), and time to maximum grade of CRS (relative to time of onset). We have identified these three key time-to-event metrics as part of our benchmarking exercise of the clinical review of approved CAR T therapeutics and because they summarize the three key temporal aspects of a medical event: when did it start, when did it stop, and at point was it at its most severe.
A Picture Is Worth A Thousand Words
If a picture is worth a thousand words, then visually presenting the above data will allow for more effective communication. While tables and listings are the most common form of presenting data in life sciences, figures have significant utility beyond Kaplan-Meier graphs of survival.
The data in Figure 1 are from the same fictitious clinical study that was used to develop Table 1; they do not represent actual data obtained from any clinical study and are intended to spark conversation and provide an illustrative example only.
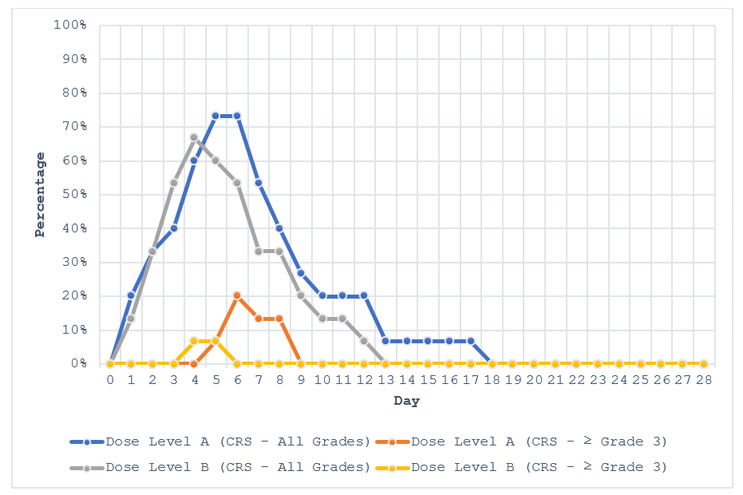
Figure 1: Cytokine Release Syndrome: Summary of Time Course by Grade According to ASTCT CRS Consensus Guidelines by Dose Level (Safety Population). CRS was coded using the ASTCT CRS consensus guidelines. ASTCT: American Society for Transplantation and Cellular Therapy; and CRS: cytokine release syndrome.
As can be seen in Figure 1, if the aim is to be effective and efficient in our communication with our audience, we can develop our elevator pitch around the following observations:
- all grades of CRS had a similar profile regardless of dose level, onset relatively quickly, and peaked between day four and day six;
- ≥ Grade 3 CRS was more pronounced in dose level A, and regardless of dose level, resolved within two to four days from onset; and
- CRS had largely resolved by day 13 for most subjects.
Although a figure will often contain less data than a table, a figure is often able to convey more meaning by displaying trends and patterns of relationships, thereby allowing you to develop an elevator pitch that can be adjusted based on audience need.
Crafting A Story
While there is a significant quantum of data that invariably sits behind Table 1 and Figure 1, both outputs are simple in their presentation. Here, the clinical drug development team can craft a vivid and rich story of the data and how this data fits within the broader clinical drug development program.
Summary
As clinical drug developers, we are often required to convey complex information in a summary format and at a level that will be understood by varying audiences, each with their own interest and purpose in understanding the data. To convey this complex information effectively, we should prepare an “elevator pitch” of key data metrics, using visual representation where possible, to maintain our audience’s attention and to quickly convey the data in a straightforward and meaningful manner.
References:
- National Cancer Institute (NCI) Common Terminology Criteria for Adverse Events (CTCAE) v5.0
- Lee DW et al, ASTCT Consensus Grading for Cytokine Release Syndrome and Neurologic Toxicity Associated with Immune Effector Cells, Biol Blood Marrow Transplant 25 (2019) 625_638.
 About the Author:
Brad Miller is the clinical operations director at Biosceptre, a company developing antibody and CAR-T therapeutics against nfP2X7. He can be found on LinkedIn.