
Analyzing And Managing CDMO Project Risks Using Causal Mechanism & Effect Analysis
By Mark F. Witcher, Ph.D., biopharma operations subject matter expert

CDMOs are a vital part of the pharmaceutical and medical device industries. Building, executing, and maintaining an effective sponsor/CDMO working relationship is critical to developing, commercializing, and manufacturing many important therapies and products. This article explains how causal mechanism and effect analysis (CMEA)1 can be used to identify, analyze, and manage risks associated with using CDMOs.
Since every sponsor–CDMO relationship can have widely different scopes, requirements, procedures, and objectives, this article focuses on the basic principles for analyzing and managing the risks of not achieving the relationship’s objectives. A search of the many articles published in Outsourced Pharma can provide additional information for identifying and understanding your CDMO options and objectives for achieving your development and manufacturing requirements.2
Managing CDMO risks is essentially the same as managing the risks associated with any project because all projects have a similar mixture of interacting processes, systems, procedures, and human activities and actions that can be described and treated as causal risk mechanisms focused on achieving a project’s objectives.
The first step in any sponsor/CDMO project is to define and align an appropriate set of objectives that include scope, timing, cost, resources, and specific quality requirements for both products and services. Once these objectives have been established and agreed, then the challenge is to develop and execute the necessary activities and tasks, especially procedures, required to realize the objectives.
Although this article assumes the reader is familiar with CMEA as described in the first reference, the following is a brief summary of CMEA’s approach in the context of managing CDMO risks.
Analyzing Risks As Causal Mechanisms
CMEA is based on a ReRA (relational risk analysis)3 modeling strategy that defines and analyzes risks as connected relationships between events with the emphasis of the analysis on identifying, understanding, analyzing, and managing the risk’s connecting causal mechanisms (CMs) that produce the risk’s outcome of either a harm or benefit outcome event.
While CMEA can be used to describe the risks of both preventing threats from causing harm (harm risks) and opportunities failing to achieve benefits (benefit risks), this article describes how a benefit risk structure can be used to increase the probability of achieving the project’s objectives. CMEA’s benefit risk model is described in Figure 1.
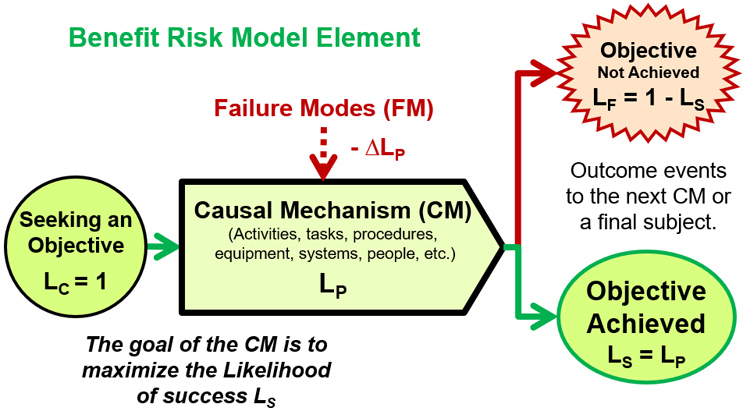
Figure 1: Structure for a CMEA benefit risk model based on using a ReRA risk modeling strategy. The risk is deliberately initiated as an opportunity (the cause) seeking to achieve an objective. Since initiating the risk is certain (LC = 1), the probability of success LS is equal to the probability LP of the CM achieving its objective. Failure modes are internal or external events that decrease the probability of the CM being successful.
CMs are combinations of actions, activities, procedures, plans, equipment, people, systems, processes, or anything else required to explain and understand how an initiating cause event such as a threat or opportunity becomes or is turned into a harm or a beneficial event, such as achieving an objective.
The purpose of a risk analysis is to identify the objective to be achieved and then identifying the CMs and their internal functions responsible for producing the objective. Each CM’s internal functions are then evaluated to determine if they have an acceptable probability of success given the significance of its impact on the value of the objective. To a large extent, a risk analysis is dissecting CMs to understand how they function to estimate their probability of success.
As explained in the first reference, CMEA uses an order-of magnitude (OoM) likelihood rating system (LX^) for describing probabilities (LX) as shown in Table 1 for concisely and efficiently estimating, discussing, and communicating the risk’s probabilities.
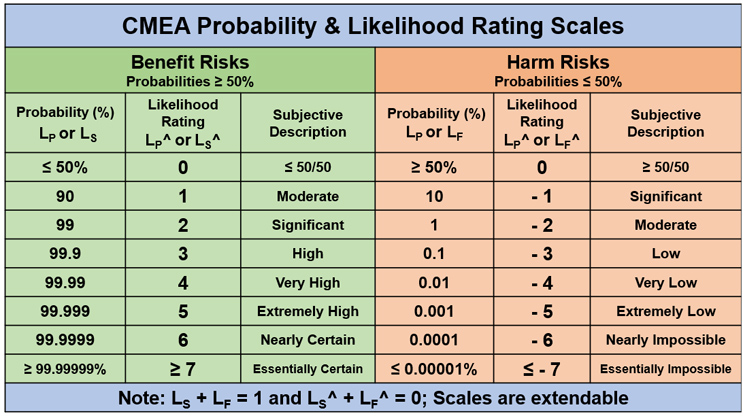
Table 1: CMEA probability and likelihood rating scales for describing a risk’s probabilities as likelihood ratings. Based on using single-trial Bernoulli probabilities, the table’s derivation can be found in the first reference. Success (benefit) and failure (harm) values and ratings obey the relationships LS + LF = 1 and LS^ + LF^ = 0.
The unambiguous likelihood rating device aids the analysis team in explicitly communicating and discussing the risk’s probabilities to reach a consensus on making acceptance and risk management decisions. The approach is especially valuable for communicating likelihoods with decision makers such as executives or regulatory authorities that did not participate in the original analysis.
The OoM likelihood rating estimates are sufficient because the purpose of the analysis is only to decide if the probabilities of success are acceptable. Since the probability of any future event that has not yet occurred is inherently a subjective belief, the probability is a subjective OoM probability stating a measure of belief estimated by the analysis team based on as much evidence the team can reasonably find and analyze. The information can be a composite of the team’s experience, knowledge, and data collected and is evaluated based on similar or comparable CMs for achieving similar objectives.
Before describing how to analyze CDMO risks, an understanding of the key CMs required to successfully complete a risk analysis is required.
Understanding The Three Mechanisms Of A Risk Analysis
For a risk analysis to be successful, three causal risk mechanisms must be effectively understood. As depicted in Figure 1, a CM explains how an outcome is produced. Every CM has a variety of failure modes that must be identified and controlled.
The first, or primary CM, is the procedure, system, or process of the risk being analyzed. The analysis team must successfully identify and evaluate the important components, including their various failure modes. If the analysis team determines that the primary CM does not have a sufficiently high likelihood of success, then the primary CM is what must be modified to make the risk acceptable.
The second CM is the analysis method used to model the primary CM, e.g., FMEA, HACCP, FTA, CMEA, etc. Many risk analyses are not successful because the analysis model does not clearly and explicitly identify and define the primary risk’s CM. One particularly insidious failure mode of some risk analysis methods is excessive complexity. For example, FMEA is very complex because it is a specialized design analysis tool that was never intended by its creators to be an approach for analyzing a broad range of risks.4,5
The third CM is the people, including their AI tools, that make up the analysis team. A risk analysis of the impact and probability of a future event requires making subjective probability estimates that can be impacted by the level of knowledge and experience of the analysis team. Any analysis team is subject to a wide variety of biases and prejudices. To reach a consensus on estimating likelihood values, the team must be aware of possible biases and work to maximize the use of expertise based on objective knowledge and verifiable facts.
For a risk analysis to be successful, the model and analysis team CMs must be understood and carefully executed. While only the primary risk needs to be analyzed in detail, CMEA’s underlying concepts and principles can be used to identify possible failure modes and improvement opportunities for the risk analysis’ method and team CMs.
Once a CM/objective risk is identified, the analysis begins describing the risk’s primary CM by constructing a process flow diagram like a system risk structure (SRS) as a sequence of CMs and connecting events from the initiating event to the final objective.
Building And Describing A Risk’s System Risk Structure
All risks are sequences of one or more dependent risk elements shown in Figure 1. The SRS is assembled to form a sequence of risks from an initiating event to the final outcome. An example of a sponsor/CDMO risk SRS for a change control process is shown in Figure 2.
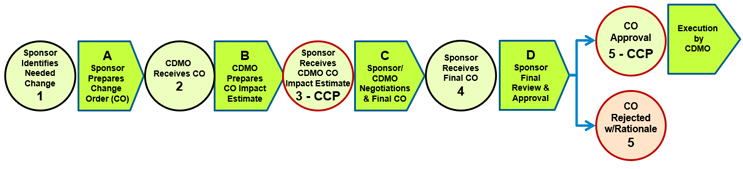
Figure 2: Example SRS of a sponsor-initiated change control process. The sponsor identifies a needed change, initiating a review and approval process summarized in the SRS as the first CM (A). By convention, CMs are lettered and the events numbered. The primary risk is that the request is not processed to a final decision (event 5) in a timely manner, harming the execution of the project. The example is discussed in more detail later in the article.
Click on image to enlarge.
For the sake of the analysis, the sponsor-initiated change control process is broken into the following CMs representing the four primary activities required for managing the request for a change to a final decision:
- Sponsor prepares change order (CO) request – The required change is identified by the sponsor and a form is filled out requesting the change for submission to the CDMO.
- Review and estimate by CDMO – The form with information is reviewed by the CDMO and a response that includes the change’s cost and timing impact is prepared. Event #3 is a critical control point (CCP) monitored by the sponsor to track if the CO is being processed in a timely and satisfactory manner.
- Sponsor/CDMO negotiations – The CO and its possible execution are negotiated by the sponsor and CDMO to reach an agreement on the CO’s cost and timing impact for execution by the CDMO.
- Final approval or rejection by sponsor – Final approval review by the sponsor results in either an approval that initiates a following execution risk (a separate risk analysis) or a rejection that might initiate a following risk analysis (not shown) associated with not implementing the change.
The change risk can be, at the discretion of the analysis team, summarized as a single CM or subdivided into additional CMs for a more detailed analysis, especially those CM activities that might be difficult to execute. For example, alternative rejection events at event #3 could cause a return to event #1 for the sponsor to make major adjustments to the CO. A similar process might also be used for a CDMO-initiated change.
The example represents the many procedures and processes required for the sponsor/CDMO relationship to be successful, including a wide variety of review and approval tasks as part of larger task sequences for executing development and manufacturing activities. In some cases, the sponsor may not have access to the SRS details of how the CDMO specifically plans to execute tasks and activities; however, the sponsor can review as much information as possible to assess the likelihood of success for the planned activity sequence, the resources to execute the sequence, timing factors, and appropriate milestones for CCPs.
After the SRS is compiled for the procedure, process, or system, it needs to be analyzed to estimate its probability of success as well as identify possible failure modes that might decrease its effectiveness or improvement opportunities that might improve its probability of successfully reaching its objective.
CMEA uses the following approach for analyzing the sequence of CMs like those shown in Figure 2.
Analyzing An SRS
Using a method adapted from the bow-tie top event model, a “top risk” model shown in Figure 3 can be used to analyze a sequence of risks like those shown in Figure 2. The analysis model is used sequentially, starting with the first CM and continuing to the last CM, to analyze each CM’s expected performance and the impact of possible failure modes of each CM.
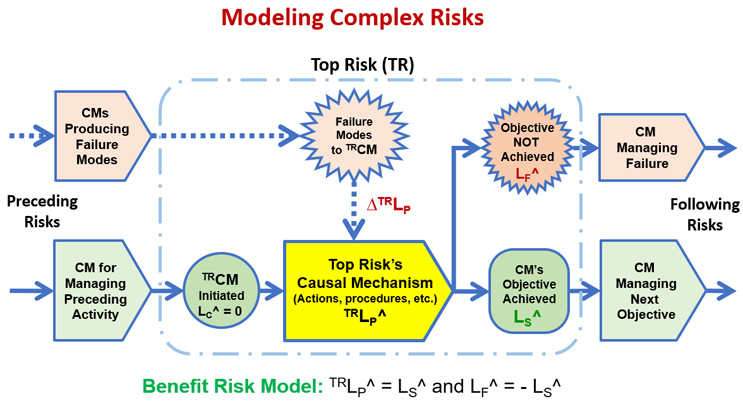
Figure 3: The top risk benefit risk model’s conceptual framework for analyzing a benefit risk composed of one or more CMs. The model is applied to each CM in the SRS sequence to identify the CM’s failure modes for estimating the TRLP for each CM in the sequence using the likelihood ratings described in Table 1.
The team’s analysis discussion using Figure 3 can be guided by the risk register template shown in Table 2.
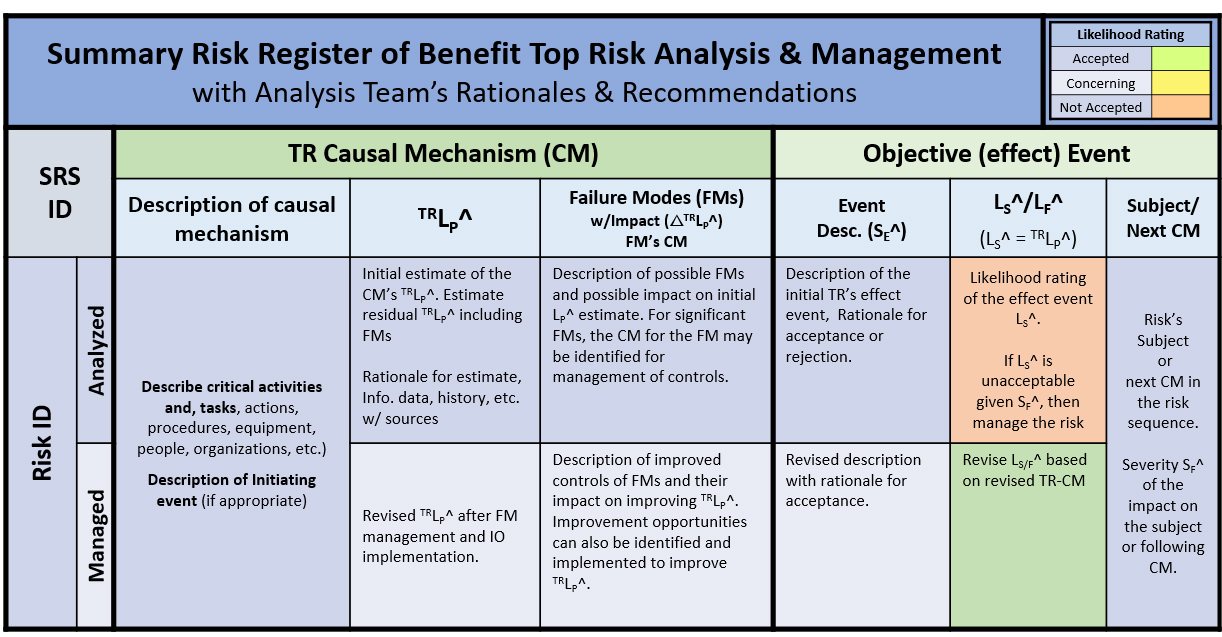
Table 2: Summary risk register format for top risk model shown in Figure 3. The register shows both the analysis and the risk’s management if it is deemed to be unacceptable or needing improvement. Each risk in the SRS is identified by the CM’s letter designation. Multiple entries for each significant FM in the TR-CM entry can be used.
The summary risk structure shows the initial analysis phase for estimating an initial TRLP^ and its failure modes. If the initial risk is unacceptable, then the risk is managed by altering the CM to improve the TRLP^ by managing failure modes and implementing improvement opportunities.
Obviously, the greatest challenge of a CMEA risk analysis is estimating the probabilities of the causal risk mechanisms.
Estimating A Risk’s Likelihood Ratings
Estimating the subjective probabilities of the CMs producing their outcomes, especially including the impact of possible failure modes, represents the most difficult challenge of any CMEA risk analysis. The challenge begins with modeling and understanding the CMs’ components and how likely they are to interact to produce each CM’s output event. The analysis team must collectively combine all the information, data, and evidence they can reasonably acquire and analyze it to create a consensus of their intuitive subjective beliefs to estimate the CMs’ LP^s.
The consensus, while not necessarily representing an agreement, can be achieved based on collectively assembling, assessing, and discussing the evidence and information, including the need to gather more information before reaching a consensus. The consensus should be supported by clear and concise rationales for the estimates provided. For some CMs, testing and mechanism validation activities for the entire or significant parts of the CM can be an important source of additional information.
The ability of a team of knowledgeable experts to estimate probabilities should not be underestimated.6 Expert or engineering judgement can provide an OoM estimate of a consequence’s likelihood of occurrence necessary for accepting or rejecting a risk.
However, as described previously, expert opinions are subject to a wide variety of biases and prejudices that must be minimized and controlled through active discussions within the analysis team to reach a consensus belief.7,8 A variety of methods are available for reconciling expert opinions and creating a rationale explaining how the OoM likelihood ratings are determined.
Using the top risk analysis strategy shown in Figure 3, the SRS shown in Figure 2 can be demonstrated using the scope change example presented in Figure 2.
Example – Scope Change Management
One of a project’s most important processes are the mechanisms used to initiate and manage changes in a project’s scope. The change process SRS introduced in Figure 2 is expanded in Figure 4 by annotating the SRS with failure modes (FMs) and improvement opportunities (IOs).
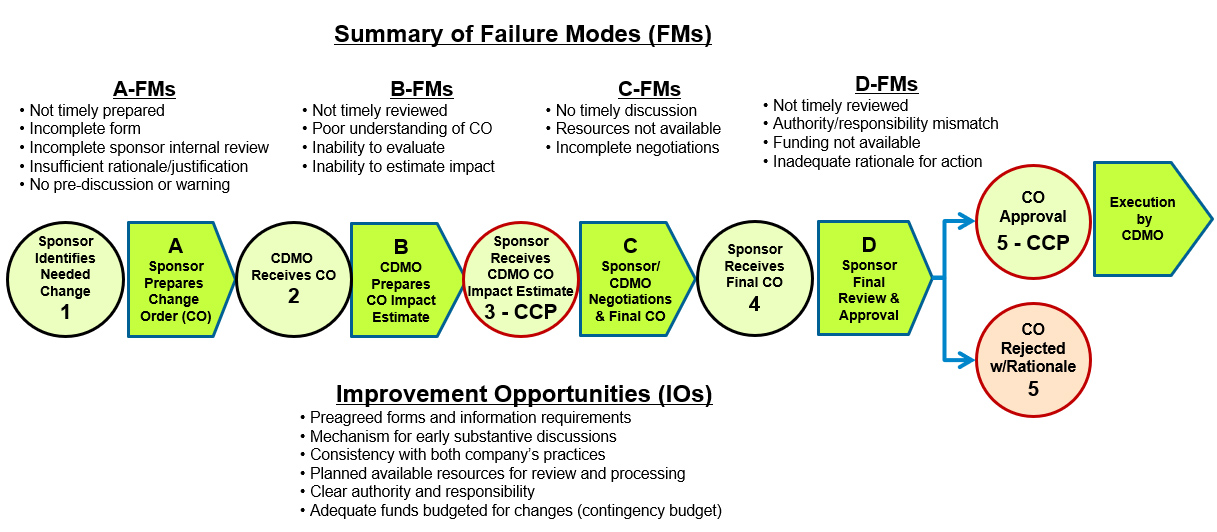
Figure 4: An annotated SRS for the change management example. The change is initiated by the sponsor identifying a need to change a process or other element in the project. The CM/procedure includes two CCPs (critical control points) that might be used to keep the project’s schedule. A summary risk register is shown in Table 3.
Click on image to enlarge.
The analysis team can generate the annotated SRS and then use the risk register-like document shown in Table 3 to document the important parts of the discussion and rationales for evaluating the likelihood ratings for the risk’s CMs.
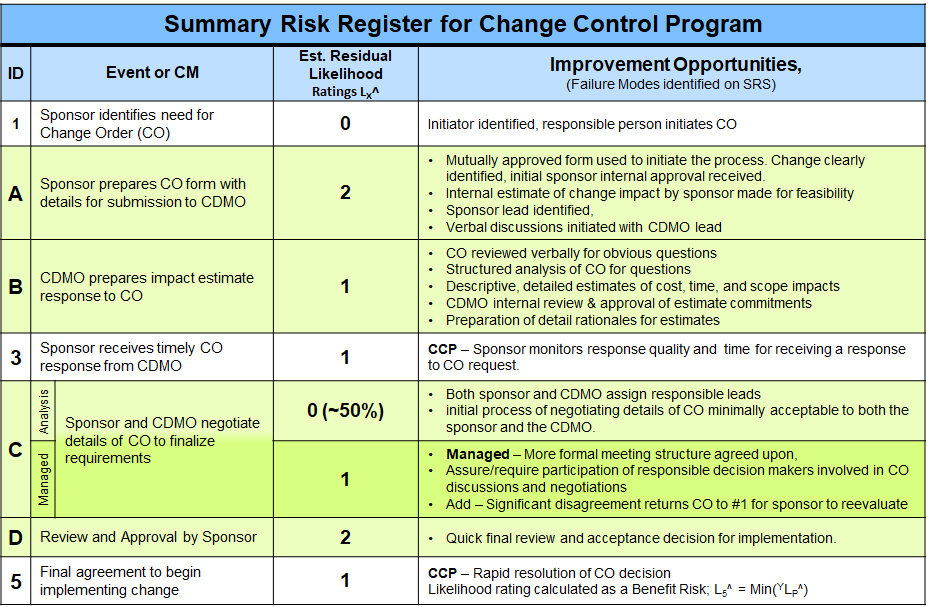
Table 3: Example summary risk register (RR) for change control SRS shown in Figure 4. The detail of the RR should be commensurate with the significance and extent of discussions regarding identification of failure modes and improvements made by the sponsor and CDMO. Click on image to enlarge.
During the analysis, the team determined that CM-3 had an unacceptable likelihood rating of roughly 0 (50%) and the CM was modified and enhanced as documented to increase the probability of a timely negotiation should an agreement on elements of the CO be difficult to resolve.
Summary
Switching from a risk event view to a benefit causal risk mechanism approach provided by CMEA can make a big difference in managing project relationships, especially those between a sponsor and a CDMO. Viewing and understanding risks as potentially bad causal mechanisms creates a very different risk analysis approach to achieving success by avoiding bad, ineffective ways of executing the projects activities and tasks. A benefit analysis and management approach creates a positive framework for building systems and methods that maximize the probability of successfully achieving the relationship’s objectives for both the sponsor and the CDMO.
While a formal risk analysis is only necessary for very important risks, the paradigm described can be used informally by both the sponsor and CDMO to review and discuss a wide variety of procedures, methods, activities, and actions to reach a common understanding of how the project will be executed.
References
- Witcher, M., Causal Mechanism And Effect Analysis (CMEA): FMEA’s Simpler, Effective Alternative, Pharmaceutical Online, May 1, 2026. https://www.pharmaceuticalonline.com/doc/causal-mechanism-and-effect-analysis-cmea-fmea-s-simpler-effective-alternative-0001
- Managing CDMOs search on Outsourced Pharma - https://www.outsourcedpharma.com/search?keyword=managing+CDMOs
- Witcher, M., Relational Risk Analysis For The Bio/Pharma Industry, Bioprocess Online, January 29, 2024. https://www.bioprocessonline.com/doc/relational-risk-analysis-for-the-bio-pharma-industry-0001
- Stamatis, D. Failure Mode and Effect Analysis, 2nd Ed., ASQ Quality Press, 2003. (842 pages) Kindle Edition.
- Carlson, C., Effective FMEAs – Achieving Safe, Reliable, and Economical Products and Processes Using Failure Mode and Effect Analysis, Wiley & Sons, 2012.
- Vick, S., Degrees of Belief – Subjective Probability and Engineering Judgment, ASCE Press, 2002.
- Kahneman, D., Thinking Fast and Slow, Farrar, Straus and Giroux, 2013.
- Kahneman, et.al., eds., Judgement Under Uncertainty: Heuristics and Biases, Cambridge Univ. Press, 1982.
About The Author:
 Mark F. Witcher, Ph.D., has over 35 years of experience in biopharmaceuticals. He currently consults with a few select companies. Previously, he worked for several engineering companies on feasibility and conceptual design studies for advanced biopharmaceutical manufacturing facilities. Witcher was an independent consultant in the biopharmaceutical industry for 15 years on operational issues related to: product and process development, strategic business development, clinical and commercial manufacturing, tech transfer, and facility design. He also taught courses on process validation for ISPE. He was previously the SVP of manufacturing operations for Covance Biotechnology Services, where he was responsible for the design, construction, start-up, and operation of their $50-million contract manufacturing facility. Prior to joining Covance, Witcher was VP of manufacturing at Amgen. You can reach him at witchermf@aol.com or on LinkedIn (linkedin.com/in/mark-witcher).